- Home >
- About Fujitsu >
- Investor Relations >
- IR Reference Library >
- Fujitsu Group Integrated Report >
- 2015 >
- Fujitsu Group Integrated Report 2015 >
- Performance Highlights
Performance Highlights
Index
FY2010 - FY2014* Financial Highlights (*FY2014: ended March 31, 2015)
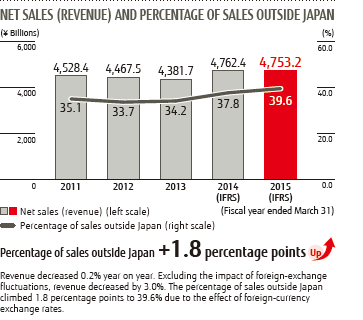
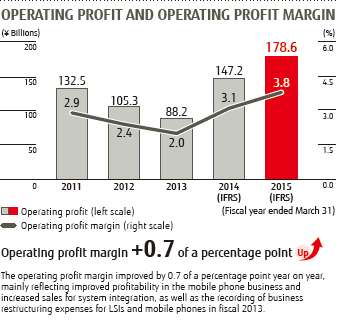
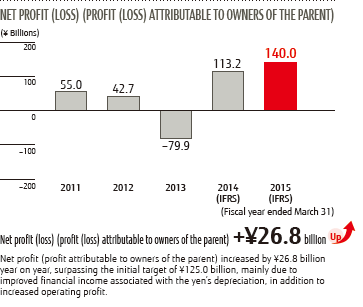
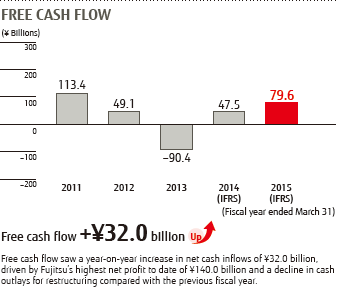
ESG (Environment, Society, and Governance) Data
Highlights from FY 2014* Financial Results (*FY2014: ended March 31, 2015)
 POINT1 Operating profit
Operating profit increased year on year, mainly reflecting improved profitability in the mobile phone business and increased sales for system integration, as well as the recording of one-time restructuring expenses for LSIs and mobile phones in fiscal 2013. However, the result was lower than the initial target due to the impact of a decline in revenue, as well as factors such as an increase in PC component costs at our European sites following the euro's depreciation against the US dollar.
 POINT2 Net profit (loss) (profit (loss) attributable to owners of the parent)
Profit attributable to owners of the parent exceeded the initial target of ¥125.0 billion. This result reflects the increase in operating profit and an increase in financial income attributable to exchange rate gains associated with the yen's reciation and other factors, as well as a lighter-than-expected tax burden.
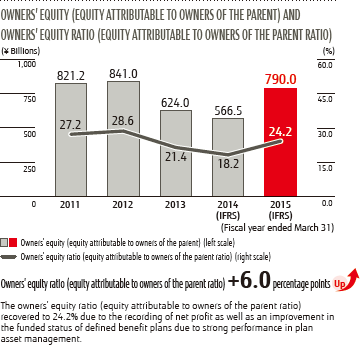
 POINT3 Owners' equity ratio (equity attributable to owners of the parent ratio)
The owners' equity ratio fell below 20% at the end of fiscal 2013 due to recording an unfunded amount of defined benefit plans on the balance sheet. However, by the end of fiscal 2014 it had recovered to 24.2%. The result reflects the recording of net profit as well as an improvement in the funded status of defined benefit plans due to strong performance in plan asset management.
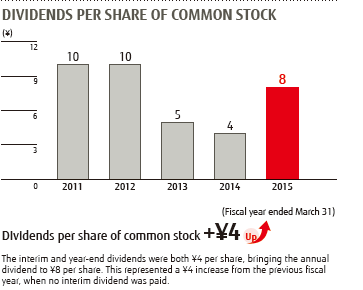
 POINT4 Dividends
Operating profit and net profit for fiscal 2014 both increased year on year. However, owners' equity (equity attributable to owners of the parent) has yet to recover to the level before recording the unfunded amount of defined benefit plans on the balance sheet. Moreover, earnings in fiscal 2015 are forecast to decline from fiscal 2014, reflecting deterioration in performance at some European sites due to the impact of the euro's rapid depreciation against the US dollar and plans for strategic investments to accelerate business model transformation.
In light of this situation, the year-end dividend for fiscal 2014 was ¥4 per share as announced in January 2015.
Combined with the interim dividend of ¥4 per share, the annual dividend for fiscal 2014 was ¥8 per share.
Ten-Year Financial Data
Point iconGraph iconIt can see relating "POINT" "Graph" by clicking.
Fujitsu Limited and Consolidated Subsidiaries
*The Fujitsu Group adopted International Financial Reporting Standards (IFRS) in fiscal 2014. Figures for fiscal 2013 are presented based on both Japanese GAAP and IFRS.
FINANCIAL DATA
| Fiscal year ended March 31 | 2006 | 2007 | 2008 | 2009 | 2010 | 2011 | 2012 | 2013 | 2014 | 2014 (IFRS) |
2015 (IFRS) |
|---|---|---|---|---|---|---|---|---|---|---|---|
| Net sales (revenue) Net sales (revenue) graph | ¥4,791,416 | ¥5,100,163 | ¥5,330,865 | ¥4,692,991 | ¥4,679,519 | ¥4,528,405 | ¥4,467,574 | ¥4,381,728 | ¥4,762,445 | ¥4,762,445 | ¥4,753,210 |
| Net sales (revenue) outside Japan | 1,591,574 | 1,825,255 | 1,923,621 | 1,499,886 | 1,748,304 | 1,587,363 | 1,506,096 | 1,498,215 | 1,801,491 | 1,801,491 | 1,879,981 |
| Percentage of sales outside Japan (%) Percentage of sales outside Japan (%) graph | 33.2 | 35.8 | 36.1 | 32.0 | 37.4 | 35.1 | 33.7 | 34.2 | 37.8 | 37.8 | 39.6 |
| Operating profit Operating profit point | 181,488 | 182,088 | 204,989 | 68,772 | 94,373 | 132,594 | 105,304 | 88,272 | 142,567 | 147,275 | 178,628 |
| Operating profit margin (%) Operating profit margin (%) graph | 3.8 | 3.6 | 3.8 | 1.5 | 2.0 | 2.9 | 2.4 | 2.0 | 3.0 | 3.1 | 3.8 |
| Net profit (loss) (profit (loss) attributable to owners of the parent) Net profit (loss) (profit (loss) attributable to owners of the parent) graph | 68,545 | 102,415 | 48,107 | (112,388) | 93,085 | 55,092 | 42,707 | (79,919) | 48,610 | 113,215 | 140,024 |
| Cash flows from operating activities | ¥405,579 | ¥408,765 | ¥322,072 | ¥248,098 | ¥295,389 | ¥255,534 | ¥240,010 | ¥71,010 | ¥175,532 | ¥176,502 | ¥280,149 |
| Cash flows from investing activities | (234,684) | (151,083) | (283,926) | (224,611) | 1,020 | (142,108) | (190,830) | (161,481) | (128,873) | (128,938) | (200,516) |
| Free cash flow Free cash flow graph | 170,895 | 257,682 | 38,146 | 23,487 | 296,409 | 113,426 | 49,180 | (90,471) | 46,659 | 47,564 | 79,633 |
| Cash flows from financing activities | (207,840) | (234,953) | 62,325 | (47,894) | (405,310) | (166,933) | (138,966) | 100,384 | (44,794) | (46,217) | (17,327) |
| Inventories | ¥408,710 | ¥412,387 | ¥383,106 | ¥306,456 | ¥322,301 | ¥341,438 | ¥334,116 | ¥323,092 | ¥330,202 | ¥330,202 | ¥313,882 |
| Monthly inventory turnover rate (times) | 0.88 | 0.93 | 1.03 | 0.98 | 1.04 | 1.02 | 1.01 | 1.00 | 1.07 | 1.07 | 1.11 |
| Total assets | 3,807,131 | 3,943,724 | 3,821,963 | 3,221,982 | 3,228,051 | 3,024,097 | 2,945,507 | 2,920,326 | 3,079,534 | 3,105,937 | 3,271,121 |
| Owners' equity (equity attributable to owners of the parent) Owners' equity (equity attributable to owners of the parent) graph | 917,045 | 969,522 | 948,204 | 748,941 | 798,662 | 821,244 | 841,039 | 624,045 | 573,211 | 566,515 | 790,089 |
| Return on equity (%) | 7.7 | 10.9 | 5.0 | (13.2) | 12.0 | 6.8 | 5.1 | (11.8) | 8.1 | 23.2 | 20.6 |
| Owners' equity ratio (equity attributable to owners of the parent ratio) (%) Owners' equity ratio (equity attributable to owners of the parent ratio) (%) graph | 24.1 | 24.6 | 24.8 | 23.2 | 24.7 | 27.2 | 28.6 | 21.4 | 18.6 | 18.2 | 24.2 |
| Return on assets (%) | 1.8 | 2.6 | 1.2 | (3.2) | 2.9 | 1.8 | 1.4 | (2.7) | 1.6 | 3.7 | 4.4 |
| Interest-bearing loans | 928,613 | 745,817 | 887,336 | 883,480 | 577,443 | 470,823 | 381,148 | 534,967 | 519,640 | 560,243 | 578,492 |
| D/E ratio (times) | 1.01 | 0.77 | 0.94 | 1.18 | 0.72 | 0.57 | 0.45 | 0.86 | 0.91 | 0.99 | 0.73 |
| Net D/E ratio (times) | 0.55 | 0.31 | 0.36 | 0.47 | 0.20 | 0.14 | 0.14 | 0.40 | 0.38 | 0.46 | 0.27 |
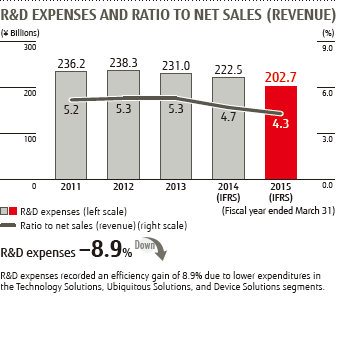
| R&D expenses R&D expenses graph | 241,566 | 254,095 | 258,717 | 249,902 | 224,951 | 236,210 | 238,360 | 231,052 | 221,389 | 222,516 | 202,722 |
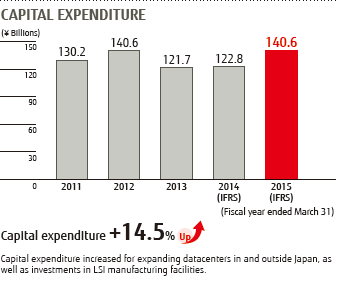
| Capital expenditure Capital expenditure graph | 249,999 | 305,285 | 249,063 | 167,690 | 126,481 | 130,218 | 140,626 | 121,766 | 122,282 | 122,863 | 140,697 |
| Depreciation | 169,843 | 202,825 | 200,509 | 223,975 | 164,844 | 141,698 | 131,577 | 116,565 | 115,180 | 115,929 | 121,207 |
| Amounts per share of common stock (yen) Amounts per share of common stock (yen) graph | |||||||||||
| Net profit (loss) (profit (loss) attributable to owners of the parent) Net profit (loss) (profit (loss) attributable to owners of the parent) graph | ¥32.83 | ¥49.54 | ¥23.34 | ¥(54.35) | ¥45.21 | ¥26.62 | ¥20.64 | ¥(38.62) | ¥23.49 | ¥54.71 | ¥67.68 |
| Dividends Dividends graph | 6 | 6 | 8 | 8 | 8 | 10 | 10 | 5 | 4 | 4 | 8 |
| Owners' equity (equity attributable to owners of the parent) Owners' equity (equity attributable to owners of the parent) graph | 443.20 | 469.02 | 458.31 | 362.30 | 386.79 | 396.81 | 406.42 | 301.57 | 277.03 | 273.79 | 381.88 |
Ten-Year ESG Data
NON-FINANCIAL DATA (ESG INDICATORS)
| 2006 | 2007 | 2008 | 2009 | 2010 | 2011 | 2012 | 2013 | 2014 | 2014 (IFRS) |
2015 (IFRS) |
|
|---|---|---|---|---|---|---|---|---|---|---|---|
| Environmental | |||||||||||
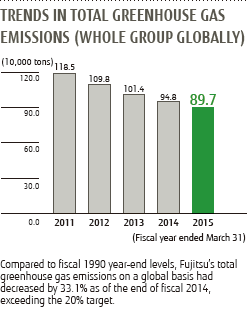
| Trends in total greenhouse gas emissions (whole group globally)(10,000 tons) | 159.8 | 153.0 | 189.4 | 166.8 | 131.3 | 118.5 | 109.8 | 101.4 | 94.8 | 94.8 | 89.7 |
| Social | |||||||||||
| Number of employees | 158,491 | 160,977 | 167,374 | 165,612 | 172,438 | 172,336 | 173,155 | 168,733 | 162,393 | 162,393 | 158,846 |
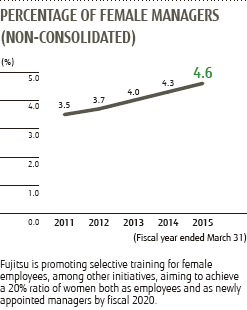
| Percentage of female managers (non-consolidated) (%) | 1.8 | 2.2 | 2.4 | 2.9 | 3.1 | 3.5 | 3.7 | 4.0 | 4.3 | 4.3 | 4.6 |
| Governance | |||||||||||
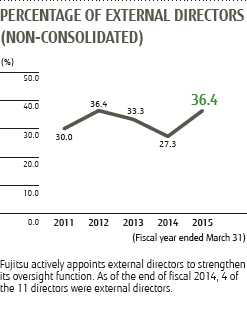
| Percentage of external directors (non-consolidated) (%) | 20.0 | 20.0 | 20.0 | 20.0 | 30.0 | 30.0 | 36.4 | 33.3 | 27.3 | 27.3 | 36.4 |
Fujitsu Group Integrated Report (PDF)
Performance Highlights (301 KB/A4, 4 pages)
