
| Yen | ||||||
| (millions) | U.S. dollars | |||||
| (except per share data and number of employees) | (thousands) | |||||
| ______________________________________________________ | _____________ | |||||
| Years ended March 31 | 1991 | 1992 | 1993 | 1994 | 1995 | 1995 |
|---|---|---|---|---|---|---|
| Net sales | 2,971,462 | 3,441,947 | 3,461,928 | 3,139,330 | 3,257,706 | 36,603,438 |
| Operating income | 214,195 | 136,849 | 64,169 | 103,357 | 165,875 | 1,863,764 |
| Income (loss) before taxes | 153,573 | 41,541 | (9,758) | 26,227 | 85,371 | 959,225 |
| Net income (loss) | 82,673 | 12,210 | (32,602) | (37,672) | 45,020 | 505,843 |
| Total assets | 3,737,170 | 3,991,543 | 3,775,831 | 3,594,743 | 3,713,816 | 41,728,270 |
| Shareholders' equity | 1,159,299 | 1,165,053 | 1,101,209 | 1,057,907 | 1,100,315 | 12,363,090 |
| Amounts per share of common stock: | ||||||
| 45.7 | 6.7 | (18.0) | (20.8) | 24.8 | 0.279 | |
| 10.0 | 10.0 | 8.0 | 8.0 | 10.0 | 0.112 | |
| 639.8 | 642.7 | 607.2 | 582.4 | 605.6 | 6.804 | |
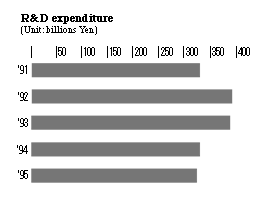
| R&D expenditure | 329,823 | 391,885 | 386,890 | 329,916 | 323,900 | 3,639,326 |
| Capital expenditure | 315,109 | 350,692 | 184,639 | 184,634 | 234,841 | 2,638,663 |
| Number of employees | 145,872 | 155,779 | 161,974 | 163,990 | 164,364 | |
| Net sales by main product: | ||||||
| 2,055,609 | 2,510,731 | 2,506,193 | 2,140,548 | 2,169,753 | 24,379,247 | |
| 441,962 | 444,901 | 473,428 | 487,942 | 500,664 | 5,625,438 | |
| 348,870 | 348,519 | 350,971 | 394,552 | 460,340 | 5,172,360 | |
| 125,021 | 137,796 | 131,336 | 116,288 | 126,949 | 1,426,393 | |
| Total | 2,971,462 | 3,441,947 | 3,461,928 | 3,139,330 | 3,257,706 | 36,603,438 |
| Net sales by customers' geographic location: | ||||||
| 2,233,493 | 2,415,151 | 2,312,524 | 2,213,694 | 2,283,353 | 25,655,652 | |
| 112,792 | 129,799 | 169,140 | 184,766 | 201,295 | 2,261,742 | |
| 337,010 | 333,226 | 353,753 | 261,273 | 280,114 | 3,147,348 | |
| 276,240 | 543,653 | 604,603 | 459,170 | 470,985 | 5,291,966 | |
| 11,927 | 20,118 | 21,908 | 20,427 | 21,959 | 246,730 | |
| Total | 2,971,462 | 3,441,947 | 3,461,928 | 3,139,330 | 3,257,706 | 36,603,438 |
During fiscal 1994, ended March 31, 1995, although Japan suffered from adverse
economic conditions influenced by the appreciation of the yen and a slumping stock
market, favorable trends continued in the U.S. and in Asian nations, while Europe
also moved towards a recovery.
In the information and communication markets, the Group benefited from a moderate
recovery in investment in Japan. Continued trends toward open systems and rightsizing
spurred the demand for personal computers and workstations among corporate users,
and there was also a strong demand for PCs from individual consumers. The demand
for semiconductors, especially memory products, maintained its high level,
particularly in overseas markets.
Under these conditions, the Group promoted its solutions business by focusing on
open systems, software and services. The Group also continued its efforts to
streamline management and promote globalization.
| Stg. Pds (millions) | ||
| Years ended December 31 | 1993 | 1994 |
|---|---|---|
| . Net sales | 2,623 | 2,655 |
| . Income before income taxes | 23 | 28 |
| . Net income for the year | 1 | 17 |
| . R&D expenditure | 209 | 173 |
Previous | Table of Contents | Next
Copyright (c) 1995 Fujitsu Limited. All Rights Reserved.
 Operating income in fiscal 1994 grew 60.5% to 165 billion Yen ($1,863 million), up
from 103 billion Yen recorded in the previous year. This was achieved by improvements
in sales, continued Group-wide cost reduction efforts and enhanced operational
efficiency. Cost of sales amounted to 2,117 billion Yen ($23,795 million), an increase
of 3.0% compared to 2,056 billion Yen in fiscal 1993. On the other hand, selling general
and administrative expenses decreased 0.6% to 974 billion Yen ($10,944 million) from
979 billion Yen in fiscal 1993. This decrease was driven by a continuing program of
restructuring and rationalizing management throughout the Group in order to increase
management efficiency.
Operating income in fiscal 1994 grew 60.5% to 165 billion Yen ($1,863 million), up
from 103 billion Yen recorded in the previous year. This was achieved by improvements
in sales, continued Group-wide cost reduction efforts and enhanced operational
efficiency. Cost of sales amounted to 2,117 billion Yen ($23,795 million), an increase
of 3.0% compared to 2,056 billion Yen in fiscal 1993. On the other hand, selling general
and administrative expenses decreased 0.6% to 974 billion Yen ($10,944 million) from
979 billion Yen in fiscal 1993. This decrease was driven by a continuing program of
restructuring and rationalizing management throughout the Group in order to increase
management efficiency.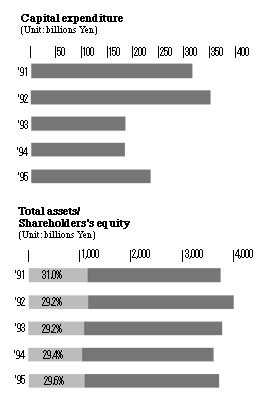 As a result, net income per share of common stock of 24.8 Yen ($0.279) was recorded, a
significant improvement from the net loss of 20.8 Yen per share of common stock in fiscal 1993.
As a result, net income per share of common stock of 24.8 Yen ($0.279) was recorded, a
significant improvement from the net loss of 20.8 Yen per share of common stock in fiscal 1993.