 |
 |
|
|

|
Yen (millions) (except per share data) |
U.S. dollars (thousands) (except per share data) |
||||
| For the years ended March 31, 1995 and 1996 | 1995 | 1996 | 1996 | ||
|---|---|---|---|---|---|
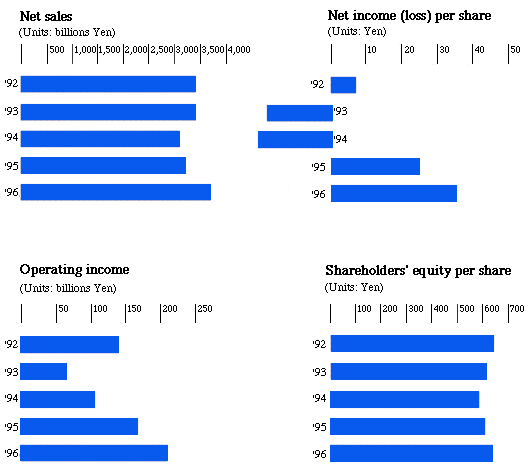
| Net sales . . . . . . . . . . . . . . . . . | 3,257,706 | 3,761,966 | 35,490,245 | ||
| Operating income . . . . . . . . . . . . . | 165,875 | 205,882 | 1,942,283 | ||
| Net income . . . . . . . . . . . . . . . . | 45,020 | 63,113 | 595,406 | ||
| Amounts per share of common stock: | |||||
| 24.8 | 34.5 | 0.325 | |||
| 10.0 | 10.0 | 0.094 | |||
| 605.6 | 624.2 | 5.889 | |||
| Number of employees . . . . . . . . . . . . | 164,364 | 165,056 | |||
| 1. | See Note 1 of Notes to Consolidated Financial Statements with respect to the calculation of net income per share. |
| 2. | The U.S. dollar amounts above and elsewhere in this Annual Report have been translated from yen, for convenience only, at the rate of 106 Yen = US$1. |


Previous | Table of Contents | Next
Copyright (c) 1996 Fujitsu Limited. All Rights Reserved.